Graph The Equation Y 4x 2
Next Genwave
Mar 09, 2025 · 6 min read
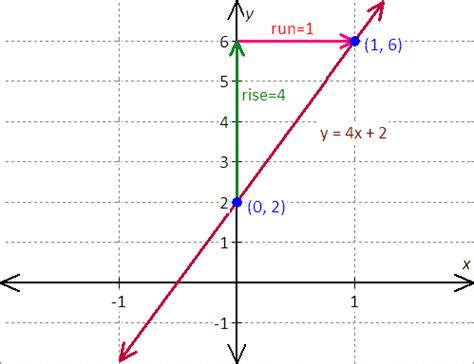
Table of Contents
Graphing the Equation y = 4x + 2: A Comprehensive Guide
Graphing equations is a fundamental skill in algebra and serves as a cornerstone for understanding various mathematical concepts. This comprehensive guide will walk you through the process of graphing the linear equation y = 4x + 2, explaining the underlying principles and providing various methods to achieve an accurate representation. We'll also delve into the properties of this specific line, its slope, y-intercept, and how to interpret its graphical representation.
Understanding the Equation: y = 4x + 2
Before we begin graphing, let's understand the structure of the equation y = 4x + 2. This equation is in the slope-intercept form, which is generally represented as y = mx + b, where:
- m represents the slope of the line. The slope indicates the steepness and direction of the line. A positive slope means the line rises from left to right, while a negative slope means it falls.
- b represents the y-intercept. The y-intercept is the point where the line crosses the y-axis (where x = 0).
In our equation, y = 4x + 2, we can identify:
- m = 4: This means the line has a slope of 4. This steep positive slope indicates a significant rise in the y-value for every unit increase in the x-value.
- b = 2: This means the line intersects the y-axis at the point (0, 2).
Method 1: Using the Slope and Y-intercept
This is arguably the simplest and most intuitive method for graphing linear equations.
-
Plot the y-intercept: Start by plotting the y-intercept, which is (0, 2). This point is located on the y-axis, two units above the origin (0,0).
-
Use the slope to find another point: The slope is 4, which can be expressed as 4/1. This means for every 1-unit increase in x, the y-value increases by 4 units. Starting from the y-intercept (0, 2), move 1 unit to the right (increasing x by 1) and 4 units up (increasing y by 4). This brings us to the point (1, 6).
-
Plot the second point and draw the line: Plot the point (1, 6). Now, draw a straight line passing through both points (0, 2) and (1, 6). This line represents the graph of the equation y = 4x + 2.
Extending the line: You can extend the line in both directions beyond the two points you've plotted to show the line's continuous nature. Every point on this line satisfies the equation y = 4x + 2.
Method 2: Creating a Table of Values
This method involves creating a table of x and y values that satisfy the equation. This approach is particularly helpful when dealing with more complex equations or when you need to ensure accuracy.
-
Choose x-values: Select a range of x-values. It's generally a good practice to include both positive and negative values, and zero. For this example, let's choose x = -2, -1, 0, 1, and 2.
-
Calculate corresponding y-values: Substitute each x-value into the equation y = 4x + 2 to calculate the corresponding y-value.
| x | y = 4x + 2 | y |
|---|---|---|
| -2 | 4(-2) + 2 | -6 |
| -1 | 4(-1) + 2 | -2 |
| 0 | 4(0) + 2 | 2 |
| 1 | 4(1) + 2 | 6 |
| 2 | 4(2) + 2 | 10 |
- Plot the points and draw the line: Plot the points (-2, -6), (-1, -2), (0, 2), (1, 6), and (2, 10) on the coordinate plane. Draw a straight line passing through these points. This line represents the graph of the equation y = 4x + 2. Notice that all the points lie on the same straight line.
Method 3: Using Graphing Software or Calculators
Many graphing calculators and software programs (like Desmos, GeoGebra, etc.) can quickly and accurately graph equations. Simply input the equation y = 4x + 2 into the software, and it will generate the graph for you. This is a particularly useful method for more complex equations or when high accuracy is required. This method is excellent for visualization and exploration.
Properties of the Line y = 4x + 2
Now that we've graphed the equation, let's examine its properties:
-
Slope (m = 4): The positive slope of 4 indicates that the line is steeply rising from left to right. For every 1 unit increase in the x-value, the y-value increases by 4 units. A steeper slope indicates a faster rate of change.
-
Y-intercept (b = 2): The y-intercept is 2, meaning the line crosses the y-axis at the point (0, 2). This is the value of y when x is 0.
-
X-intercept: To find the x-intercept (where the line crosses the x-axis, where y = 0), we set y = 0 in the equation and solve for x:
0 = 4x + 2 -2 = 4x x = -1/2 = -0.5
The x-intercept is (-0.5, 0).
-
Linear Equation: The equation y = 4x + 2 represents a linear equation because it produces a straight line when graphed. Linear equations are characterized by a constant rate of change (the slope).
Applications and Interpretations
The graph of y = 4x + 2 can be used to represent various real-world situations. For example:
-
Cost of a Service: Imagine a service charges a flat fee of $2 plus $4 per unit of service. The equation y = 4x + 2 could represent the total cost (y) based on the number of units of service (x). The graph would then allow you to quickly determine the total cost for any given number of units.
-
Distance vs. Time: If an object is moving at a constant speed of 4 units per unit of time and starts at a position of 2 units, the equation could describe its position (y) at a given time (x).
-
Temperature Conversion: While not a perfect fit without adjustments, a linear relationship could approximately represent the conversion between two temperature scales.
Advanced Concepts and Extensions
-
Parallel and Perpendicular Lines: Any line parallel to y = 4x + 2 will have the same slope (m = 4) but a different y-intercept. A line perpendicular to y = 4x + 2 will have a slope that is the negative reciprocal of 4, which is -1/4.
-
Systems of Equations: The graph of y = 4x + 2 can be used to solve systems of linear equations graphically. The point of intersection between the line y = 4x + 2 and another line represents the solution to the system.
-
Inequalities: The equation can be extended to inequalities, such as y > 4x + 2 or y ≤ 4x + 2. Graphing these inequalities would involve shading regions above or below the line, respectively.
-
Transformations: Understanding how transformations affect the graph is crucial. For instance, y = 4x + 2 + 3 would shift the graph upwards by 3 units. y = 4(x-1) + 2 would shift the graph to the right by 1 unit.
This comprehensive guide provides multiple methods for graphing the equation y = 4x + 2, explains the properties of the resulting line, and explores real-world applications and advanced concepts. By mastering these techniques, you will build a strong foundation in algebra and develop essential skills for solving problems involving linear equations and their graphical representations. Remember that practice is key to mastering these concepts. Try graphing different linear equations to solidify your understanding.
Latest Posts
Latest Posts
-
How To Find Limit When H Is 0
Mar 10, 2025
-
1 1 7 As An Improper Fraction
Mar 10, 2025
-
Write 21 50 As A Decimal Number
Mar 10, 2025
-
8 48 Rounded To The Nearest Tenth
Mar 10, 2025
-
3 125 Rounded To The Nearest Tenth
Mar 10, 2025
Related Post
Thank you for visiting our website which covers about Graph The Equation Y 4x 2 . We hope the information provided has been useful to you. Feel free to contact us if you have any questions or need further assistance. See you next time and don't miss to bookmark.
