Graph The Line With Slope And -intercept .
Next Genwave
Mar 06, 2025 · 6 min read
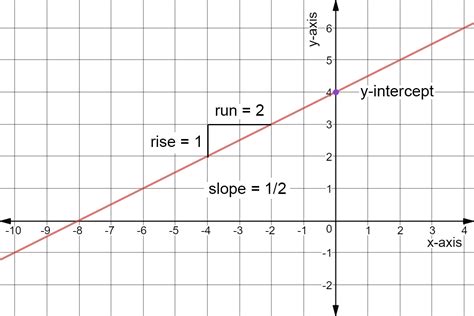
Table of Contents
Graphing Lines Using Slope and Y-Intercept: A Comprehensive Guide
Understanding how to graph a line using its slope and y-intercept is a fundamental skill in algebra. This ability forms the bedrock for understanding linear equations and their applications across various fields, from physics and engineering to economics and finance. This comprehensive guide will walk you through the process, covering various scenarios and providing you with a deep understanding of the underlying concepts.
Understanding the Equation of a Line
The most common way to represent a line is using the slope-intercept form of a linear equation:
y = mx + b
Where:
- y represents the y-coordinate of any point on the line.
- x represents the x-coordinate of any point on the line.
- m represents the slope of the line, indicating its steepness and direction. A positive slope indicates an upward trend from left to right, while a negative slope indicates a downward trend.
- b represents the y-intercept, which is the y-coordinate of the point where the line intersects the y-axis (where x = 0).
Determining Slope and Y-Intercept
Before you can graph a line, you need to identify its slope (m) and y-intercept (b). This can be done in several ways:
1. From the Equation:
If the equation of the line is already in the slope-intercept form (y = mx + b), simply identify the values of 'm' and 'b'. For example:
- y = 2x + 3: The slope (m) is 2, and the y-intercept (b) is 3.
- y = -1/2x - 1: The slope (m) is -1/2, and the y-intercept (b) is -1.
- y = x: The slope (m) is 1 (since x is equivalent to 1x), and the y-intercept (b) is 0.
2. From Two Points:
If you have two points on the line, (x₁, y₁) and (x₂, y₂), you can calculate the slope using the following formula:
m = (y₂ - y₁) / (x₂ - x₁)
Once you have the slope, you can find the y-intercept by substituting the coordinates of one of the points and the slope into the equation y = mx + b and solving for b.
For example, let's say you have the points (1, 2) and (3, 6):
- Calculate the slope: m = (6 - 2) / (3 - 1) = 4 / 2 = 2
- Find the y-intercept: Using the point (1, 2) and the slope m = 2, we get: 2 = 2(1) + b. Solving for b, we find b = 0. Therefore, the equation of the line is y = 2x + 0, or simply y = 2x.
3. From a Graph:
If you have a graph of the line, you can determine the slope and y-intercept visually:
- Y-intercept: Find the point where the line crosses the y-axis. The y-coordinate of this point is the y-intercept (b).
- Slope: Identify two points on the line. Count the vertical change (rise) and the horizontal change (run) between these points. The slope (m) is the rise divided by the run (rise/run).
Graphing the Line
Once you have the slope (m) and the y-intercept (b), you can graph the line using these steps:
-
Plot the y-intercept: Locate the point (0, b) on the y-axis. This is your starting point.
-
Use the slope to find another point: The slope (m) represents the rise over the run (rise/run). From the y-intercept, move vertically (rise) by the numerator of the slope and horizontally (run) by the denominator. This gives you a second point on the line. Remember to move upwards if the slope is positive and downwards if it's negative. Move right if the denominator is positive and left if it's negative.
-
Draw the line: Draw a straight line through the two points you've plotted. This line represents the graph of the equation.
Examples:
Example 1: y = 3x - 2
- Y-intercept (b) = -2: Plot the point (0, -2).
- Slope (m) = 3/1: From (0, -2), move up 3 units and right 1 unit to reach the point (1, 1).
- Draw the line: Draw a straight line through (0, -2) and (1, 1).
Example 2: y = -1/2x + 1
- Y-intercept (b) = 1: Plot the point (0, 1).
- Slope (m) = -1/2: From (0, 1), move down 1 unit and right 2 units to reach the point (2, 0). Alternatively, move up 1 unit and left 2 units to reach (-2, 2).
- Draw the line: Draw a straight line through (0, 1) and (2, 0).
Example 3: y = -x
- Y-intercept (b) = 0: Plot the point (0, 0).
- Slope (m) = -1: From (0,0), move down 1 unit and right 1 unit to reach the point (1, -1).
- Draw the line: Draw a straight line through (0, 0) and (1, -1).
Handling Special Cases
Horizontal Lines:
Horizontal lines have a slope of 0 (m = 0). Their equation is of the form y = b, where b is the y-intercept. To graph a horizontal line, simply draw a straight line through all points with the y-coordinate equal to b.
Vertical Lines:
Vertical lines have an undefined slope. Their equation is of the form x = a, where 'a' is the x-intercept (the point where the line crosses the x-axis). To graph a vertical line, simply draw a straight line through all points with the x-coordinate equal to a.
Practical Applications
The ability to graph lines using slope and y-intercept has numerous practical applications:
-
Modeling real-world phenomena: Linear equations are frequently used to model relationships between variables in various fields. For example, the relationship between distance and time at a constant speed, or the relationship between cost and quantity of a product.
-
Data analysis: Graphing lines helps visualize data and identify trends. For instance, you might graph a line to represent the growth of a company's revenue over time.
-
Solving systems of equations: Graphing lines can be a helpful visual aid when solving systems of linear equations. The intersection point of two lines represents the solution to the system.
-
Geometry: Lines and their properties are fundamental to geometric concepts and constructions.
Advanced Techniques and Considerations
-
Using different forms of linear equations: While the slope-intercept form is commonly used, other forms like the point-slope form (y - y₁ = m(x - x₁)) and the standard form (Ax + By = C) can also be used to graph lines. These forms are particularly useful when dealing with specific information like a point on the line and its slope or when you need to convert an equation into a different form.
-
Using technology: Graphing calculators and software can help you quickly and accurately graph lines. These tools are particularly useful when dealing with complex equations or large datasets.
Conclusion
Mastering the skill of graphing lines using slope and y-intercept is essential for success in algebra and its various applications. By understanding the concepts of slope and y-intercept and following the steps outlined in this guide, you can confidently graph lines from their equations, from given points, or from visual representations. Remember to practice regularly to solidify your understanding and build your skills. The more you practice, the more intuitive and effortless this process will become, paving the way for more advanced mathematical concepts and problem-solving abilities. This comprehensive guide aims to equip you not just with the mechanical steps but also with the conceptual understanding needed to truly master this fundamental aspect of algebra.
Latest Posts
Latest Posts
-
What Is The Percent Of 8 15
Mar 06, 2025
-
What Is 2 1 2 As A Decimal
Mar 06, 2025
-
How Many Yards Are In 24 Feet
Mar 06, 2025
-
What Percentage Of 25 Is 15
Mar 06, 2025
-
What Is 9 12 As A Percent
Mar 06, 2025
Related Post
Thank you for visiting our website which covers about Graph The Line With Slope And -intercept . . We hope the information provided has been useful to you. Feel free to contact us if you have any questions or need further assistance. See you next time and don't miss to bookmark.
