How To Graph 3x Y 6
Next Genwave
Mar 10, 2025 · 6 min read
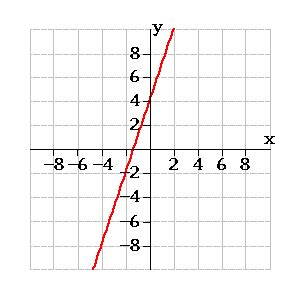
Table of Contents
How to Graph 3x + y = 6: A Comprehensive Guide
This article provides a comprehensive guide on how to graph the linear equation 3x + y = 6, exploring various methods and delving into the underlying mathematical concepts. We'll cover everything from basic plotting to understanding the slope-intercept form and using technology for graphing. By the end, you'll not only know how to graph this specific equation but also possess a robust understanding of graphing linear equations in general.
Understanding the Equation: 3x + y = 6
Before we dive into graphing, let's understand what the equation 3x + y = 6 represents. This is a linear equation in two variables, x and y. A linear equation always produces a straight line when graphed. The equation shows a relationship between x and y; for every value of x, there's a corresponding value of y that satisfies the equation.
Method 1: Finding Intercepts (x-intercept and y-intercept)
This is perhaps the simplest method for graphing a linear equation. It involves finding the points where the line intersects the x-axis (x-intercept) and the y-axis (y-intercept).
Finding the x-intercept:
The x-intercept is the point where the line crosses the x-axis. At this point, the y-coordinate is always 0. To find the x-intercept, set y = 0 in the equation and solve for x:
3x + 0 = 6 3x = 6 x = 2
Therefore, the x-intercept is (2, 0).
Finding the y-intercept:
The y-intercept is the point where the line crosses the y-axis. At this point, the x-coordinate is always 0. To find the y-intercept, set x = 0 in the equation and solve for y:
3(0) + y = 6 y = 6
Therefore, the y-intercept is (0, 6).
Plotting the Intercepts and Drawing the Line:
Now that we have two points, (2, 0) and (0, 6), we can plot them on a coordinate plane. Simply draw a straight line passing through these two points. This line represents the graph of the equation 3x + y = 6.
Key takeaway: The intercept method is efficient and easy to understand, especially for beginners. It's highly recommended for simple linear equations.
Method 2: Converting to Slope-Intercept Form (y = mx + b)
The slope-intercept form, y = mx + b, provides valuable information about the line. 'm' represents the slope (the steepness of the line), and 'b' represents the y-intercept.
Let's convert the equation 3x + y = 6 to slope-intercept form:
3x + y = 6 y = -3x + 6
From this form, we can directly identify:
- Slope (m) = -3: This indicates that for every 1-unit increase in x, y decreases by 3 units. The negative slope signifies a downward-sloping line.
- y-intercept (b) = 6: This confirms our earlier finding that the line crosses the y-axis at (0, 6).
Plotting Using Slope and y-intercept:
- Plot the y-intercept: Start by plotting the point (0, 6) on the coordinate plane.
- Use the slope to find another point: Since the slope is -3, we can move from the y-intercept one unit to the right (increase x by 1) and three units down (decrease y by 3). This gives us the point (1, 3). You can also choose to move 2 units right and 6 units down, or any other multiple of the slope to easily find more points.
- Draw the line: Draw a straight line passing through the two points (0, 6) and (1, 3). This line represents the graph of 3x + y = 6.
Key takeaway: The slope-intercept form provides a deeper understanding of the line's characteristics, and using the slope to find additional points can be advantageous for more accurate graphing.
Method 3: Creating a Table of Values
This method involves choosing several values for x, substituting them into the equation, and solving for the corresponding y values. This creates a table of (x, y) coordinates that can be plotted on the coordinate plane.
Let's create a table with a few x values:
| x | y = -3x + 6 | (x, y) |
|---|---|---|
| -1 | 9 | (-1, 9) |
| 0 | 6 | (0, 6) |
| 1 | 3 | (1, 3) |
| 2 | 0 | (2, 0) |
| 3 | -3 | (3, -3) |
Plot these points (x,y) on a coordinate plane, and draw a straight line that connects them. This line represents the graph of 3x + y = 6.
Key takeaway: This method is versatile and can be applied to any type of linear equation, even those not easily converted to slope-intercept form.
Method 4: Using Graphing Technology
Graphing calculators and online graphing tools can quickly and accurately plot linear equations. Simply input the equation 3x + y = 6 (or its slope-intercept form, y = -3x + 6) into the graphing tool and it will generate the graph for you. Many tools allow you to zoom, pan, and even analyze the line's properties like slope and intercepts.
Key takeaway: Technology is a valuable asset for graphing complex equations or for quickly visualizing the graph for checking your work done with other methods. However, understanding the underlying mathematical principles is crucial for a solid grasp of the concept.
Understanding the Slope and its Significance
The slope of the line, -3, signifies the rate of change of y with respect to x. It tells us how much y changes for every unit change in x. In this case, for every one-unit increase in x, y decreases by 3 units. This constant rate of change is a defining characteristic of linear relationships. A positive slope would indicate an upward-sloping line, while a negative slope, as we have here, indicates a downward-sloping line.
Applications of Linear Equations
Linear equations have wide-ranging applications in various fields:
- Physics: Modeling motion, calculating velocity, and analyzing forces.
- Engineering: Designing structures, analyzing circuits, and predicting system behavior.
- Economics: Forecasting economic trends, modeling supply and demand, and analyzing cost functions.
- Business: Analyzing profit margins, projecting sales, and determining pricing strategies.
Understanding how to graph linear equations is a fundamental skill in these and many other areas.
Solving Problems Involving the Equation
Let's explore a couple of example problems related to the equation 3x + y = 6:
Problem 1: Find the value of y when x = 4.
Substitute x = 4 into the equation:
3(4) + y = 6 12 + y = 6 y = 6 - 12 y = -6
Therefore, when x = 4, y = -6. The point (4, -6) lies on the line.
Problem 2: Find the value of x when y = 0.
We already solved this in the intercept method, but let's do it again:
Substitute y = 0 into the equation:
3x + 0 = 6 3x = 6 x = 2
Therefore, when y = 0, x = 2. This confirms our x-intercept.
Conclusion
Graphing the equation 3x + y = 6, or any linear equation, involves understanding the relationship between the variables and applying various methods to visually represent that relationship. Whether you choose the intercept method, the slope-intercept form, creating a table of values, or using graphing technology, the underlying mathematical principles remain consistent. Mastering these methods provides a solid foundation for tackling more complex mathematical concepts and real-world applications. Remember to practice regularly to solidify your understanding and improve your graphing skills. The more you practice, the easier it will become.
Latest Posts
Latest Posts
-
What Is 1 1 3 Times 3
Mar 10, 2025
-
2 X 3 3 X 2
Mar 10, 2025
-
What Is 10 11 As A Decimal
Mar 10, 2025
-
5 4 3 2 1 Math Term
Mar 10, 2025
-
4 1 2 As A Mixed Number
Mar 10, 2025
Related Post
Thank you for visiting our website which covers about How To Graph 3x Y 6 . We hope the information provided has been useful to you. Feel free to contact us if you have any questions or need further assistance. See you next time and don't miss to bookmark.
