How Do You Find The Lower Class Limit
Next Genwave
Mar 10, 2025 · 6 min read
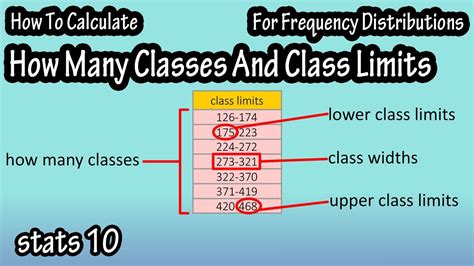
Table of Contents
How Do You Find the Lower Class Limit? A Comprehensive Guide
Finding the lower class limit is a fundamental step in data analysis, particularly when working with grouped frequency distributions. Understanding how to determine this value is crucial for accurately interpreting and visualizing data, making informed decisions, and effectively communicating findings. This comprehensive guide will delve into various methods for determining the lower class limit, exploring different contexts and providing practical examples to solidify your understanding.
Understanding Grouped Frequency Distributions and Class Intervals
Before diving into the mechanics of finding the lower class limit, let's establish a firm grasp of the context. Grouped frequency distributions are used to organize and summarize large datasets. Instead of listing each individual data point, we categorize them into groups or classes, each with a specific range of values. This simplifies the data while still preserving essential information.
Each class in a grouped frequency distribution is defined by its lower class limit and upper class limit. The lower class limit represents the smallest value that can belong to a particular class, while the upper class limit represents the largest value. The difference between the upper and lower class limits defines the class width or class interval.
Example: Consider a dataset representing the ages of participants in a marathon. We might group the ages into classes like 20-29, 30-39, 40-49, and so on. In the class "20-29," the lower class limit is 20, and the upper class limit is 29. The class width is 10 (29 - 20 + 1).
Methods for Finding the Lower Class Limit
The approach to finding the lower class limit depends on how the data is presented and the specific context of your analysis. Here are some common scenarios and their respective methods:
1. Direct Observation from the Frequency Distribution Table
The most straightforward method is when the grouped frequency distribution table explicitly provides the lower class limit for each class. Simply look at the table; the first number in each class interval is the lower class limit.
Example:
| Age Group | Frequency |
|---|---|
| 20-29 | 15 |
| 30-39 | 22 |
| 40-49 | 18 |
| 50-59 | 8 |
In this example, the lower class limits are 20, 30, 40, and 50.
2. Calculating the Lower Class Limit from the Class Width and Upper Class Limit
If the class width and upper class limit are known, you can easily calculate the lower class limit. Subtract the class width from the upper class limit of the class immediately below.
Example: Let's assume a class width of 10 and an upper class limit of 29 for a particular class. The lower class limit would be:
Lower Class Limit = Upper Class Limit (of the previous class) - Class Width + 1 = 19 -10 +1 = 10.
It's important to add 1 to account for the inclusive nature of the class boundaries (unless explicitly stated otherwise).
3. Determining the Lower Class Limit from Raw Data
When dealing with raw data (i.e., the individual data points), you'll need to follow these steps:
- Determine the Range: Find the difference between the highest and lowest values in your dataset. This gives you the overall range of your data.
- Choose the Number of Classes: The number of classes you select will influence the class width. There are various rules of thumb for choosing the number of classes, such as Sturges' rule or the square root rule. The selection depends on the dataset size and desired level of detail.
- Calculate the Class Width: Divide the range by the number of classes. Round up to the nearest convenient number to ensure all data points are included within the class intervals.
- Determine the Lower Class Limit of the First Class: This is typically the minimum value in your dataset or a slightly lower, convenient round number.
Example: Consider a dataset of test scores: 72, 85, 91, 68, 78, 82, 95, 75, 88, 90.
- Range: 95 - 68 = 27
- Number of Classes: Let's choose 5 classes (a reasonable choice for this dataset size).
- Class Width: 27 / 5 ≈ 6 (rounded up for convenience).
- Lower Class Limit of the First Class: We could choose 65 as a convenient round number slightly lower than the minimum score (68).
This will give us the following classes:
- 65-70
- 71-76
- 77-82
- 83-88
- 89-94
The lower class limits are 65, 71, 77, 83, and 89 respectively. Note that the last class might need adjustment to include the highest value if your chosen class width doesn't perfectly encompass the range.
4. Handling Exclusive and Inclusive Class Intervals
It is crucial to understand the difference between exclusive and inclusive class intervals.
-
Exclusive Class Intervals: These intervals do not include the upper limit of each class. For example, 0-10, 10-20, 20-30 means that values equal to 10, 20, and so on, are included in the subsequent class. The lower class limit is the starting value.
-
Inclusive Class Intervals: These intervals include both the lower and upper limits of each class. For example, 0-9, 10-19, 20-29. The lower class limit is the starting value.
The method for determining the lower class limit remains the same regardless of the class interval type, but careful attention to the inclusion or exclusion of the upper limits is essential when interpreting the data.
Importance of Correctly Identifying the Lower Class Limit
Accurately determining the lower class limit is vital for several reasons:
- Accurate Data Representation: Incorrect lower class limits lead to misrepresentation of the data, potentially leading to flawed conclusions.
- Meaningful Data Analysis: Correctly defined classes are essential for calculating descriptive statistics like mean, median, and mode for grouped data.
- Effective Data Visualization: Histograms and other visual representations rely on correctly defined classes to display the data accurately.
- Valid Statistical Inference: If the lower class limit is wrong, the subsequent statistical inferences and conclusions drawn from the data will be invalid.
Advanced Considerations and Applications
The principles discussed above apply broadly to various data analysis situations. However, specific circumstances may require additional considerations:
- Open-Ended Classes: Some grouped frequency distributions may have open-ended classes, such as "less than 10" or "greater than 50". These classes do not have a defined upper or lower limit, respectively. In such cases, the lower class limit is typically explicitly stated.
- Unequal Class Widths: While generally undesirable, sometimes unequal class widths are necessary to accommodate the distribution of data. The methods described still apply, but extra care is needed in interpreting results.
- Software Applications: Many statistical software packages automate the process of creating grouped frequency distributions, including the calculation of class limits. However, understanding the underlying principles is vital to ensure the validity of the output and make informed decisions about data representation.
Conclusion
Finding the lower class limit is a crucial step in organizing and analyzing grouped data. The method employed depends on the data's presentation and specific context. Whether you are working with a frequency distribution table, raw data, or dealing with different types of class intervals, this guide provides a comprehensive approach to accurately determine the lower class limits. Mastering this fundamental skill is essential for anyone involved in data analysis and interpretation. Remember always to double-check your calculations and understand the implications of your choices in class width and number of classes to ensure the accuracy and validity of your analysis. Careful attention to these details will lead to more effective data representation and more reliable conclusions.
Latest Posts
Latest Posts
-
39 Out Of 40 As A Percentage
Mar 10, 2025
-
Y 1 2x 3 In Standard Form
Mar 10, 2025
-
S 2prh 2pr 2 Solve For H
Mar 10, 2025
-
What Is The Value Of 11 2
Mar 10, 2025
-
What Is The Cube Root Of 1000
Mar 10, 2025
Related Post
Thank you for visiting our website which covers about How Do You Find The Lower Class Limit . We hope the information provided has been useful to you. Feel free to contact us if you have any questions or need further assistance. See you next time and don't miss to bookmark.
