How Do You Graph Y 3x 1
Next Genwave
Mar 06, 2025 · 6 min read
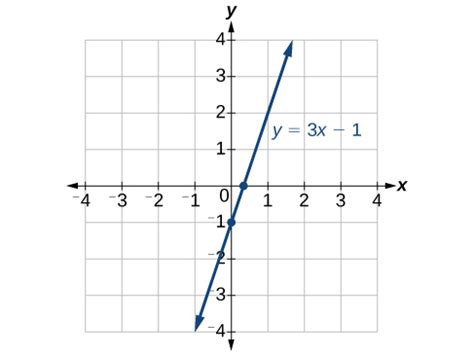
Table of Contents
How Do You Graph y = 3x + 1? A Comprehensive Guide
Understanding how to graph linear equations is a fundamental skill in algebra. This comprehensive guide will walk you through the process of graphing the equation y = 3x + 1, explaining the concepts involved, and providing multiple methods for achieving this. We’ll also explore related concepts and offer tips for success.
Understanding the Equation: y = 3x + 1
This equation represents a linear relationship between x and y. It's in the slope-intercept form, which is expressed as:
y = mx + b
Where:
- y is the dependent variable (its value depends on x).
- x is the independent variable (its value is chosen freely).
- m is the slope of the line (it indicates the steepness and direction of the line). A positive slope means the line goes upward from left to right; a negative slope means it goes downward.
- b is the y-intercept (the point where the line crosses the y-axis, i.e., where x = 0).
In our equation, y = 3x + 1:
- m = 3 (the slope is 3, indicating a steep upward incline).
- b = 1 (the y-intercept is 1, meaning the line crosses the y-axis at the point (0, 1)).
Method 1: Using the Slope and Y-Intercept
This is the most straightforward method for graphing linear equations in slope-intercept form.
-
Plot the y-intercept: Begin by plotting the point (0, 1) on the coordinate plane. This is where the line intersects the y-axis.
-
Use the slope to find another point: The slope, 3, can be expressed as 3/1 (rise over run). This means for every 1 unit increase in x (the run), y increases by 3 units (the rise).
- Starting from the y-intercept (0, 1), move 1 unit to the right (increase x by 1) and 3 units up (increase y by 3). This brings you to the point (1, 4).
-
Plot the second point and draw the line: Plot the point (1, 4). Now, draw a straight line passing through both points (0, 1) and (1, 4). This line represents the graph of y = 3x + 1.
Important Note: You can use the slope to find more points to ensure accuracy. For example, you could move 2 units to the right and 6 units up from (0,1) to get the point (2,7), or move 1 unit to the left and 3 units down to get the point (-1,-2). All these points will lie on the same line.
Method 2: Creating a Table of Values
This method involves creating a table of x and y values that satisfy the equation.
-
Choose x-values: Select several values for x. It's a good idea to choose both positive and negative values, including zero. For example, let's choose x = -2, -1, 0, 1, and 2.
-
Calculate corresponding y-values: Substitute each x-value into the equation y = 3x + 1 to calculate the corresponding y-value.
| x | y = 3x + 1 | y | Point (x, y) |
|---|---|---|---|
| -2 | 3(-2) + 1 | -5 | (-2, -5) |
| -1 | 3(-1) + 1 | -2 | (-1, -2) |
| 0 | 3(0) + 1 | 1 | (0, 1) |
| 1 | 3(1) + 1 | 4 | (1, 4) |
| 2 | 3(2) + 1 | 7 | (2, 7) |
- Plot the points and draw the line: Plot the points from the table on the coordinate plane. Draw a straight line that passes through all the points. This line represents the graph of y = 3x + 1.
Method 3: Using Intercepts and a Third Point
This method uses the y-intercept and finds the x-intercept to plot the line. It then uses a third point as a check.
-
Find the y-intercept: As we know, the y-intercept is 1 (the point (0,1)).
-
Find the x-intercept: The x-intercept is the point where the line crosses the x-axis (where y = 0). To find it, set y = 0 in the equation and solve for x:
0 = 3x + 1 -1 = 3x x = -1/3
So the x-intercept is (-1/3, 0).
-
Choose a third point: Select any other value for x (let's use x = 2) and substitute it into the equation to find the corresponding y-value:
y = 3(2) + 1 = 7
This gives us the point (2, 7).
-
Plot the points and draw the line: Plot the points (0, 1), (-1/3, 0), and (2, 7). Draw a straight line passing through these points. This line represents the graph of y = 3x + 1. The third point serves as a verification that the line is correctly drawn.
Understanding the Slope and its Implications
The slope of 3 in the equation y = 3x + 1 is crucial to understanding the graph. It tells us:
-
Steepness: A slope of 3 signifies a relatively steep line. The larger the absolute value of the slope, the steeper the line.
-
Direction: The positive slope indicates that the line rises as x increases (from left to right). A negative slope would indicate a line that falls as x increases.
-
Rate of Change: The slope represents the rate of change of y with respect to x. For every one-unit increase in x, y increases by 3 units.
Advanced Concepts and Extensions
-
Parallel Lines: Any line with the same slope (m = 3) as y = 3x + 1 will be parallel to it. These lines will never intersect.
-
Perpendicular Lines: A line perpendicular to y = 3x + 1 will have a slope that is the negative reciprocal of 3, which is -1/3.
-
Systems of Equations: Graphing y = 3x + 1 alongside another linear equation allows you to visually find the solution (intersection point) of the system of equations.
-
Non-Linear Equations: While this guide focuses on linear equations, the principles of plotting points and understanding the relationship between variables apply to other types of equations as well (though the graphs will have different shapes).
Tips for Graphing Linear Equations
-
Use graph paper: Graph paper ensures accuracy in plotting points and drawing lines.
-
Label your axes: Clearly label the x-axis and y-axis with their respective units.
-
Choose appropriate scales: Select scales for the x and y axes that allow you to comfortably plot all your points within the graph's boundaries.
-
Check your work: Always double-check your calculations and plotted points to ensure accuracy.
-
Use technology: Graphing calculators or online graphing tools can help verify your work and provide a visual representation of the graph.
Conclusion
Graphing the equation y = 3x + 1 is a fundamental skill in algebra. By understanding the slope-intercept form, using various graphing methods, and grasping the concept of slope, you can accurately represent this linear equation visually. Remember to practice regularly to build confidence and mastery of this essential mathematical concept. The techniques presented here extend beyond this specific equation and are applicable to a wide range of linear equations, forming the foundation for tackling more advanced mathematical problems.
Latest Posts
Latest Posts
-
Limit As X Approaches Negative Infinity
Mar 06, 2025
-
9 Is What Percent Of 20
Mar 06, 2025
-
Integral Of 1 Square Root Of X
Mar 06, 2025
-
120 25 30 30 20
Mar 06, 2025
-
What Is The Percentage Of 1 12
Mar 06, 2025
Related Post
Thank you for visiting our website which covers about How Do You Graph Y 3x 1 . We hope the information provided has been useful to you. Feel free to contact us if you have any questions or need further assistance. See you next time and don't miss to bookmark.
