How To Graph Y 2x 6
Next Genwave
Mar 06, 2025 · 5 min read
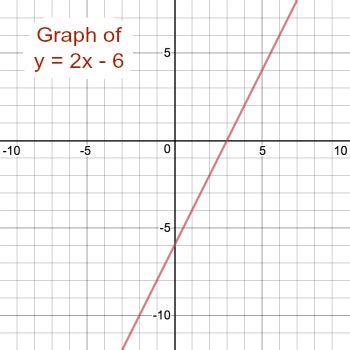
Table of Contents
How to Graph y = 2x + 6: A Comprehensive Guide
Graphing linear equations is a fundamental skill in algebra. This comprehensive guide will walk you through the process of graphing the equation y = 2x + 6, covering multiple methods and explaining the underlying concepts. We'll explore various approaches, ensuring you understand not only how to graph the equation but also why each method works. By the end, you'll be confident in graphing any linear equation.
Understanding the Equation: y = 2x + 6
Before we delve into graphing techniques, let's understand the equation itself. This is a linear equation, meaning its graph will be a straight line. It's written in slope-intercept form, which is:
y = mx + b
Where:
- y represents the vertical coordinate (the y-value)
- x represents the horizontal coordinate (the x-value)
- m represents the slope of the line (how steep the line is)
- b represents the y-intercept (where the line crosses the y-axis)
In our equation, y = 2x + 6:
- m = 2 This means the slope is 2, or 2/1. A slope of 2 indicates that for every 1 unit increase in x, y increases by 2 units.
- b = 6 This means the y-intercept is 6. The line crosses the y-axis at the point (0, 6).
Understanding these components is crucial for efficient graphing.
Method 1: Using the Slope and Y-intercept
This is the most straightforward method, leveraging the information directly from the slope-intercept form.
Step 1: Plot the Y-intercept
Since the y-intercept is 6, plot a point at (0, 6) on your coordinate plane.
Step 2: Use the Slope to Find Another Point
The slope is 2/1. This means from the y-intercept (0,6), move 1 unit to the right (positive x-direction) and 2 units up (positive y-direction). This brings you to the point (1, 8).
Step 3: Draw the Line
Connect the two points (0, 6) and (1, 8) with a straight line. This line represents the graph of y = 2x + 6. Extend the line beyond these points to show that it continues infinitely in both directions.
Method 2: Using the X and Y-intercepts
This method involves finding where the line intersects both the x and y axes.
Step 1: Find the Y-intercept
As we already know, the y-intercept is 6 (when x = 0, y = 6). Plot the point (0, 6).
Step 2: Find the X-intercept
The x-intercept is where the line crosses the x-axis (where y = 0). To find it, set y = 0 in the equation and solve for x:
0 = 2x + 6 -6 = 2x x = -3
Plot the point (-3, 0).
Step 3: Draw the Line
Connect the points (0, 6) and (-3, 0) with a straight line. This line represents the graph of y = 2x + 6.
Method 3: Using a Table of Values
This method involves creating a table of x and y values that satisfy the equation.
Step 1: Create a Table
Create a table with columns for x and y:
| x | y = 2x + 6 |
|---|---|
| -2 | |
| -1 | |
| 0 | |
| 1 | |
| 2 |
Step 2: Calculate Y-values
Substitute each x-value into the equation y = 2x + 6 to calculate the corresponding y-value:
| x | y = 2x + 6 |
|---|---|
| -2 | 2 |
| -1 | 4 |
| 0 | 6 |
| 1 | 8 |
| 2 | 10 |
Step 3: Plot the Points and Draw the Line
Plot the points (-2, 2), (-1, 4), (0, 6), (1, 8), and (2, 10) on your coordinate plane. Connect the points with a straight line to graph y = 2x + 6.
Method 4: Using Technology
Graphing calculators and online graphing tools can quickly and accurately plot linear equations. Simply input the equation y = 2x + 6 into the calculator or tool, and it will generate the graph. This is a useful method for checking your work or for graphing more complex equations. Many free online graphing calculators are available.
Interpreting the Graph
The graph of y = 2x + 6 is a straight line with a positive slope, indicating a positive relationship between x and y. As x increases, y increases. The line intersects the y-axis at 6 and the x-axis at -3. Every point on this line represents a pair of (x, y) values that satisfy the equation y = 2x + 6.
Advanced Concepts and Applications
Understanding the graph of y = 2x + 6 opens doors to more advanced concepts:
-
Systems of Equations: You can use this graph to solve systems of equations by finding the point(s) of intersection between the line y = 2x + 6 and other lines.
-
Inequalities: The line can be used to represent inequalities. For example, y > 2x + 6 would represent the region above the line, while y < 2x + 6 would represent the region below the line.
-
Real-World Applications: Linear equations like y = 2x + 6 have numerous real-world applications in areas such as:
- Physics: Modeling motion, velocity, and acceleration.
- Economics: Representing cost functions, supply and demand curves.
- Engineering: Designing structures and systems.
Troubleshooting Common Mistakes
-
Incorrect Slope: Ensure you're correctly interpreting the slope (m) from the equation. Remember that the slope is the change in y divided by the change in x.
-
Incorrect Y-intercept: Make sure you're accurately identifying the y-intercept (b) from the equation. It's the point where the line crosses the y-axis.
-
Plotting Points Incorrectly: Double-check that you're accurately plotting points on the coordinate plane. Carefully pay attention to the signs of the x and y values.
-
Not Extending the Line: Remember to extend the line beyond the points you've plotted to show that it continues infinitely.
Conclusion
Graphing y = 2x + 6, or any linear equation, is a fundamental skill with wide-ranging applications. By mastering the methods outlined in this guide, you'll gain a strong foundation in algebra and be well-equipped to tackle more complex mathematical challenges. Remember to practice regularly, utilizing different methods to reinforce your understanding. The ability to visualize and interpret linear equations is key to success in numerous academic and professional fields.
Latest Posts
Latest Posts
-
What Is 7 2 As A Fraction
Mar 06, 2025
-
Write The Exponential Expression Using Radicals
Mar 06, 2025
-
What Percentage Of 30 Is 25
Mar 06, 2025
-
How To Factor X 3 2
Mar 06, 2025
-
Y 5x 7 3x 2y 12
Mar 06, 2025
Related Post
Thank you for visiting our website which covers about How To Graph Y 2x 6 . We hope the information provided has been useful to you. Feel free to contact us if you have any questions or need further assistance. See you next time and don't miss to bookmark.
