How To Graph Y 4x 2
Next Genwave
Mar 10, 2025 · 6 min read
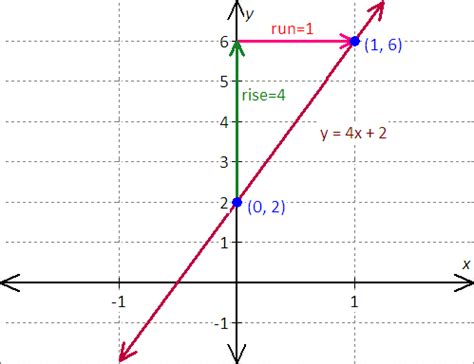
Table of Contents
How to Graph y = 4x + 2: A Comprehensive Guide
Graphing linear equations is a fundamental skill in algebra. Understanding how to plot a line on a coordinate plane based on its equation is crucial for various mathematical applications and problem-solving scenarios. This comprehensive guide will walk you through the process of graphing the equation y = 4x + 2, explaining various methods and providing you with a deep understanding of the underlying concepts.
Understanding the Equation: y = 4x + 2
Before we delve into graphing, let's analyze the equation itself. This is a linear equation written in the slope-intercept form, which is represented as:
y = mx + b
Where:
- y represents the y-coordinate.
- x represents the x-coordinate.
- m represents the slope of the line (the steepness of the line).
- b represents the y-intercept (the point where the line crosses the y-axis).
In our equation, y = 4x + 2:
- m = 4 This indicates a slope of 4, meaning for every 1 unit increase in x, y increases by 4 units.
- b = 2 This signifies a y-intercept of 2, meaning the line crosses the y-axis at the point (0, 2).
Method 1: Using the Slope-Intercept Form Directly
This is the most straightforward method, leveraging the information directly from the equation.
Step 1: Plot the y-intercept
Since the y-intercept is 2, plot a point at (0, 2) on the coordinate plane.
Step 2: Use the slope to find another point
The slope is 4, which can be expressed as 4/1. This means a rise of 4 units and a run of 1 unit. Starting from the y-intercept (0, 2):
- Rise: Move 4 units upwards along the y-axis.
- Run: Move 1 unit to the right along the x-axis.
This brings you to the point (1, 6). Plot this point on the coordinate plane.
Step 3: Draw the line
Using a ruler or straight edge, draw a line that passes through both points (0, 2) and (1, 6). This line represents the graph of the equation y = 4x + 2. Extend the line beyond these points to show its continuous nature.
Method 2: Creating a Table of Values
This method is particularly useful when you need multiple points for accurate graphing or when dealing with more complex equations.
Step 1: Choose x-values
Select a few x-values. It's best to choose values that are easy to work with, such as -2, -1, 0, 1, and 2.
Step 2: Calculate corresponding y-values
Substitute each x-value into the equation y = 4x + 2 to calculate the corresponding y-values.
| x | y = 4x + 2 | y | (x, y) Coordinates |
|---|---|---|---|
| -2 | 4(-2) + 2 | -6 | (-2, -6) |
| -1 | 4(-1) + 2 | -2 | (-1, -2) |
| 0 | 4(0) + 2 | 2 | (0, 2) |
| 1 | 4(1) + 2 | 6 | (1, 6) |
| 2 | 4(2) + 2 | 10 | (2, 10) |
Step 3: Plot the points
Plot each (x, y) coordinate pair from the table onto the coordinate plane.
Step 4: Draw the line
Draw a straight line that passes through all the plotted points. This line represents the graph of y = 4x + 2.
Method 3: Using Intercepts and One Additional Point
This method combines finding the intercepts with calculating one more point for increased accuracy.
Step 1: Find the y-intercept
As we already know, the y-intercept is 2 (the point (0, 2)).
Step 2: Find the x-intercept
To find the x-intercept, set y = 0 and solve for x:
0 = 4x + 2 -2 = 4x x = -1/2 or -0.5
This gives us the x-intercept at (-0.5, 0).
Step 3: Calculate a third point
Choose any other x-value (other than 0 or -0.5) and calculate the corresponding y-value using the equation. For example, if we choose x = 1:
y = 4(1) + 2 = 6
This gives us the point (1, 6).
Step 4: Plot the points and draw the line
Plot the three points: (0, 2), (-0.5, 0), and (1, 6). Draw a straight line through these points to graph y = 4x + 2.
Interpreting the Graph
The graph of y = 4x + 2 is a straight line with a positive slope. This indicates a positive correlation between x and y – as x increases, y also increases. The steeper the slope (in this case, 4), the faster y increases with respect to x. The y-intercept of 2 shows where the line intersects the y-axis.
Advanced Concepts and Applications
Understanding the graph of y = 4x + 2 extends beyond simply plotting points. It allows us to:
- Predict values: Given an x-value, you can easily determine the corresponding y-value using the equation or the graph. Similarly, you can find the x-value for a given y-value.
- Solve systems of equations: Graphing this line alongside another linear equation allows you to find the point of intersection, which represents the solution to the system.
- Model real-world scenarios: Linear equations frequently model real-world situations, such as calculating costs based on quantity (e.g., the total cost y of buying x items at $4 each, with a $2 shipping fee).
- Analyze rate of change: The slope (4) represents the rate of change of y with respect to x. In our example, this might be a rate of change of cost per item or a speed.
Troubleshooting Common Mistakes
- Incorrect slope interpretation: Ensure you understand the rise over run concept when using the slope. A slope of 4 means a rise of 4 for every 1 run, not the other way around.
- Inaccurate plotting: Double-check your coordinate points before drawing the line to avoid errors.
- Not using a ruler: Always use a straight edge or ruler to draw the line for accuracy.
- Confusing x and y intercepts: Remember that the x-intercept is where the line crosses the x-axis (y=0), and the y-intercept is where it crosses the y-axis (x=0).
Conclusion
Graphing linear equations like y = 4x + 2 is a fundamental skill in mathematics with broad applications. By mastering the different methods outlined in this guide, you can accurately and efficiently graph linear equations, enhancing your understanding of linear relationships and their real-world significance. Remember to practice regularly to solidify your skills and confidently approach more complex graphing challenges. Through understanding the slope-intercept form, creating tables of values, or using a combination of intercepts and additional points, you can effectively visualize and interpret linear relationships. The ability to graph these equations forms a strong foundation for more advanced mathematical concepts.
Latest Posts
Latest Posts
-
How Do You Find The Lower Class Limit
Mar 10, 2025
-
What Is 37 As A Decimal
Mar 10, 2025
-
Round 14 To The Nearest Ten
Mar 10, 2025
-
What Is X 3 X 4
Mar 10, 2025
-
What Is 20 25 As A Percent
Mar 10, 2025
Related Post
Thank you for visiting our website which covers about How To Graph Y 4x 2 . We hope the information provided has been useful to you. Feel free to contact us if you have any questions or need further assistance. See you next time and don't miss to bookmark.
