Graph Of Sin X And Cos X
Next Genwave
Mar 06, 2025 · 7 min read
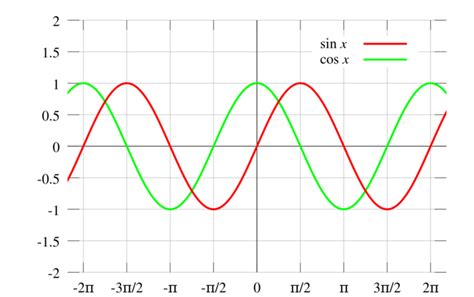
Table of Contents
Graphs of sin x and cos x: A Comprehensive Exploration
The sine (sin x) and cosine (cos x) functions are fundamental building blocks in trigonometry, calculus, and numerous scientific applications. Understanding their graphs is crucial for grasping their properties and behavior. This comprehensive guide delves into the graphs of sin x and cos x, exploring their key features, relationships, and applications.
Understanding the Unit Circle
Before diving into the graphs, let's revisit the unit circle. The unit circle is a circle with a radius of 1 centered at the origin (0,0) of the Cartesian coordinate system. For any angle θ (theta), the coordinates of the point where the terminal side of the angle intersects the unit circle are given by (cos θ, sin θ). This fundamental connection forms the basis for visualizing the sine and cosine functions.
Key takeaways from the unit circle:
- Cosine (x-coordinate): The x-coordinate of the point on the unit circle represents the cosine of the angle.
- Sine (y-coordinate): The y-coordinate represents the sine of the angle.
- Periodicity: As the angle θ increases, the point on the unit circle traces a complete circle. This illustrates the periodic nature of sine and cosine, with a period of 2π radians (or 360 degrees).
The Graph of sin x
The graph of y = sin x is a continuous wave that oscillates between -1 and 1. It's a smooth, periodic function with several key characteristics:
Key Features of the sin x Graph:
- Amplitude: The amplitude is the distance from the midline (y=0) to the maximum or minimum value. For sin x, the amplitude is 1.
- Period: The period is the horizontal distance it takes for the graph to complete one full cycle. For sin x, the period is 2π.
- Midline: The midline is the horizontal line that runs halfway between the maximum and minimum values. For sin x, the midline is y = 0.
- x-intercepts: The x-intercepts occur where sin x = 0. This happens at integer multiples of π (..., -2π, -π, 0, π, 2π, ...).
- Maximum and Minimum Values: The maximum value is 1, occurring at x = π/2 + 2kπ (where k is an integer). The minimum value is -1, occurring at x = 3π/2 + 2kπ.
- Increasing and Decreasing Intervals: The function is increasing on intervals like (2kπ - π/2, 2kπ + π/2) and decreasing on intervals like (2kπ + π/2, 2kπ + 3π/2), where k is an integer.
The Graph of cos x
The graph of y = cos x is remarkably similar to the graph of y = sin x. It's also a continuous wave oscillating between -1 and 1, with a period of 2π. However, there's a crucial phase shift.
Key Features of the cos x Graph:
- Amplitude: The amplitude, like sin x, is 1.
- Period: The period is 2π, identical to sin x.
- Midline: The midline is y = 0.
- x-intercepts: The x-intercepts occur at x = π/2 + kπ, where k is an integer.
- Maximum and Minimum Values: The maximum value is 1, occurring at x = 2kπ (where k is an integer). The minimum value is -1, occurring at x = (2k+1)π.
- Increasing and Decreasing Intervals: Similar to sin x, the intervals of increase and decrease follow a pattern determined by the periodicity.
Relationship Between sin x and cos x
The graphs of sin x and cos x are essentially identical, except for a horizontal shift (phase shift). Specifically, the graph of cos x is identical to the graph of sin(x + π/2). This means that cos x is a shifted version of sin x. This relationship can be visualized by observing that the cosine function starts at its maximum value (1) when x = 0, while the sine function starts at 0.
Transformations of sin x and cos x
Understanding the basic graphs of sin x and cos x allows us to predict the behavior of their transformations. These transformations involve changes in amplitude, period, phase shift, and vertical shift.
Amplitude Changes:
The equation y = A sin x or y = A cos x results in a graph with an amplitude of |A|. If |A| > 1, the graph is stretched vertically, and if 0 < |A| < 1, the graph is compressed vertically.
Period Changes:
The equation y = sin(Bx) or y = cos(Bx) has a period of 2π/|B|. If |B| > 1, the period is shorter, and if 0 < |B| < 1, the period is longer.
Phase Shift:
The equation y = sin(x - C) or y = cos(x - C) shifts the graph horizontally by C units. A positive C value shifts the graph to the right, while a negative C value shifts it to the left. This is often referred to as a phase shift.
Vertical Shift:
The equation y = sin x + D or y = cos x + D shifts the graph vertically by D units. A positive D value shifts the graph upwards, and a negative D value shifts it downwards.
Applications of sin x and cos x Graphs
The sine and cosine functions, and their graphs, find widespread applications across various fields:
Physics:
- Simple Harmonic Motion (SHM): The oscillatory motion of a pendulum, a mass on a spring, or a wave can be modeled using sine and cosine functions. The graphs help visualize the displacement, velocity, and acceleration as a function of time.
- Wave Phenomena: Sound waves, light waves, and water waves all exhibit sinusoidal behavior. The graphs help analyze wave characteristics like wavelength, frequency, and amplitude.
- Alternating Current (AC) Circuits: The voltage and current in an AC circuit vary sinusoidally with time. Graphing these functions helps understand circuit behavior.
Engineering:
- Signal Processing: Sine and cosine waves are fundamental components in signal processing. Fourier analysis uses these functions to decompose complex signals into simpler sinusoidal components.
- Control Systems: Sinusoidal inputs are often used to test and analyze the response of control systems. The graphs help visualize the system's stability and performance.
Computer Graphics and Animation:
- Modeling Curves and Shapes: Sine and cosine functions are used to create smooth curves and shapes in computer graphics and animation.
- Creating Realistic Movement: These functions are crucial in creating realistic-looking movement, such as the swaying of trees or the ripples of water.
Other Applications:
- Modeling Biological Rhythms: Many biological processes, such as heartbeats and sleep cycles, exhibit rhythmic behavior that can be modeled using sine and cosine functions.
- Music: Sound waves are sinusoidal, and the graphs of these waves help understand musical tones and harmonies.
- Astronomy: Orbital motions of planets can be described using trigonometric functions, facilitating predictions of planetary positions.
Advanced Concepts and Further Exploration
This discussion provides a foundation for understanding the graphs of sin x and cos x. For more advanced study, consider exploring these topics:
- Inverse Trigonometric Functions: Understanding the inverse functions (arcsin, arccos) and their graphs provides a deeper understanding of the relationship between angles and their trigonometric values.
- Trigonometric Identities: Mastering trigonometric identities enables manipulation and simplification of trigonometric expressions, which are essential in solving complex problems involving sine and cosine functions.
- Differential and Integral Calculus: The derivatives and integrals of sine and cosine functions are crucial in calculus and its applications.
- Fourier Series: This powerful tool allows the representation of periodic functions as an infinite sum of sine and cosine functions.
Conclusion
The graphs of sin x and cos x are not just abstract mathematical constructs; they are essential tools for understanding a vast array of phenomena in the physical world. This comprehensive guide has explored the key features, relationships, and applications of these functions. By mastering the principles outlined here, you'll be well-equipped to tackle more advanced concepts and utilize the power of these fundamental trigonometric functions in your studies and applications. Remember that practice is key to solidifying your understanding, so keep exploring and experimenting with the properties of these essential graphs.
Latest Posts
Latest Posts
-
Y 3x 5 5x 4y 3
Mar 06, 2025
-
3 To The Power Of 1
Mar 06, 2025
-
Factor Of X 2 X 6
Mar 06, 2025
-
What Percentage Of 5 Is 3
Mar 06, 2025
-
1 7x 6 7 X 36
Mar 06, 2025
Related Post
Thank you for visiting our website which covers about Graph Of Sin X And Cos X . We hope the information provided has been useful to you. Feel free to contact us if you have any questions or need further assistance. See you next time and don't miss to bookmark.
